Ruby on Rails performance comparison
DHH moved HEY's backend to Rust and said so at Rails World 2026, and the question that follows every report of it is whether Rails is fast enough for what you are building. The answers on offer are framework benchmark tables, and a framework benchmark table measures a program that is not your program: a handler that reads one row and serialises it, running on a machine tuned for the run, with no view layer, no front matter, no analytics write and no 70 KB of HTML.
So this page measures the other thing. One laptop, one application, three floors: Ruby with no Rails, Rails with no application, and the application this site actually serves. The distance between those three is where the answer to "is Rails fast enough" lives, and it is not where the comparison tables put it.
Conditions, because a number without them is not checkable. Apple M2 Max, 12 cores, 32 GB, macOS
arm64-darwin25. Ruby 4.0.5 (2026-05-20 revision 64336ffd0e) with PRISM, built by RVM without YJIT
(ruby --yjit answers Ruby was built without YJIT support) and with no RubyVM::ZJIT constant
either, so nothing below is jitted. Rails 8.1.3.1, Puma 8.0.2, pg 1.6.3, redcarpet 3.6.1, rouge
4.7.0. PostgreSQL 17.7 (Homebrew) on the same machine, port 15432, loopback only. RAILS_ENV=production
with assets precompiled, ASSUME_SSL=true so force_ssl does not turn every request into a 301,
and RAILS_LOG_LEVEL=error. Load generated by ApacheBench 2.3 (Revision 1923142) at
/usr/sbin/ab, against 127.0.0.1, so there is no network in any of these numbers. Every endpoint
was warmed with 100 requests before the run that counted.
What this machine does with no Rails in the way
A Rack application of one line, served by the same Puma with the same thread settings, is the ceiling everything else is measured against:
# hello.ru
run ->(env) { [ 200, { "content-type" => "text/plain" }, [ "Hello" ] ] }
$ bundle exec puma -p 3006 -t 3:3 hello.ru
$ ab -n 3000 -c 1  -q http://127.0.0.1:3006/   ->  9,759.53 [#/sec]
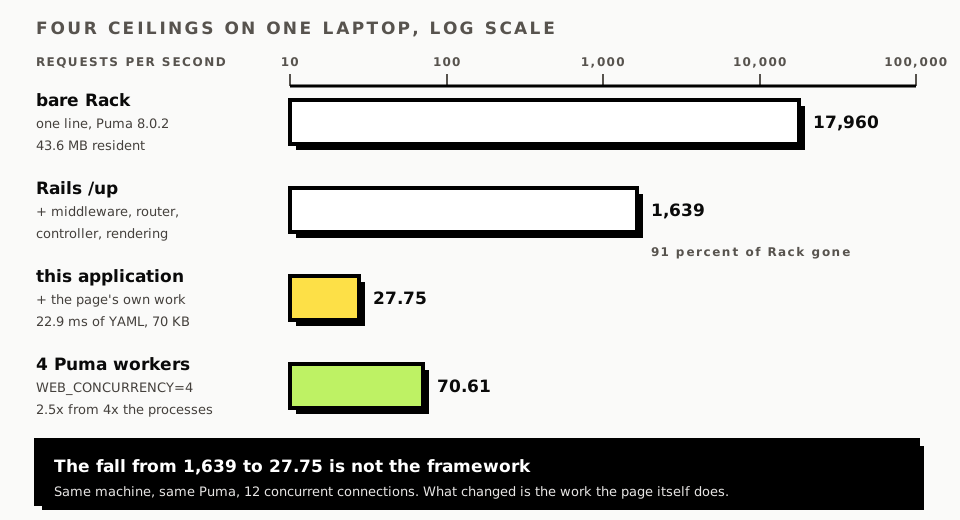
$ ab -n 5000 -c 12 -q http://127.0.0.1:3006/   ->  17,960.48 [#/sec]
That process was 43.6 MB resident. Two things are worth taking from it. Ruby and Puma are not the constraint at any traffic level a product of this size will see. And the jump from one connection to twelve is only 1.8x on a 12 core machine, because a single Puma process runs Ruby under one global VM lock whatever the thread count says; the extra throughput is the threads overlapping socket work, not twelve cores doing twelve things.
Rails with nothing to do answers 1,639 requests per second
/up is Rails::HealthController#show. It routes, runs the middleware stack, renders a 73 byte body
and touches no database. Same machine, same Puma, one process, Min threads: 3, Max threads: 3:
ab -n 1000 -c 1  /up   ->  1,398.98 [#/sec]   mean 0.715 ms   p99 1 ms
ab -n 3000 -c 3  /up   ->  1,587.58 [#/sec]                   p99 3 ms
ab -n 3000 -c 12 /up   ->  1,639.09 [#/sec]   p50 7 ms  p95 9 ms  p99 11 ms
Rails gives up about 91 percent of the bare Rack ceiling to do nothing at all: 17,960 down to 1,639. That is the middleware stack, the router, the controller instantiation and the rendering machinery, and it is a fixed tax on every request whatever the request does. It is also, at 0.6 ms per request, the part of your latency budget you will never think about again, because the next number is two orders of magnitude larger.
Note the shape of the concurrency column rather than the headline. Going from 1 connection to 12 bought 17 percent more throughput and multiplied the median latency by seven. Under the GVL, extra concurrency into a single process converts almost entirely into queueing, and p99 is where you see it first.
The page this site actually serves answers 27.75
/yield/rails-time-zones is a real page of this site: it finds a Markdown article, records a view,
reads the counter back, finds its two neighbours, renders 25,622 bytes of Markdown to HTML through
redcarpet and rouge, and ships 70,283 bytes of HTML inside the landing layout. Seven SQL queries,
ActiveRecord: 1.4ms in the production log.
ab -n 500  -c 1  /yield/rails-time-zones  ->  25.93 [#/sec]  mean 38.571 ms  p50 37  p95 48  p99 88
ab -n 1000 -c 3  /yield/rails-time-zones  ->  28.08 [#/sec]  mean 106.825 ms
ab -n 1000 -c 12 /yield/rails-time-zones  ->  27.75 [#/sec]  mean 432.433 ms p50 432 p95 464 p99 488
The other two public pages land in the same place. /yield, the index, renders 92,737 bytes and
answered 28.37 at one connection and 24.13 at twelve. The homepage renders 98,449 bytes and answered
32.76 and 25.66, with a p99 of 1,069 ms at twelve connections.
So the honest headline for this application is 27 requests per second per process, not 1,639 and certainly not the four and five figure numbers in the comparison tables. Throughput is flat from 1 connection to 12 because the work is CPU bound in Ruby, and the GVL means a second thread has nothing to do while the first one is computing. All twelve added were latency.
Where the other 33 milliseconds went
Seven queries and 1.4 ms of ActiveRecord do not explain a 38 ms request, so the parts were timed
individually in the same production process, 50 iterations each, with
Process.clock_gettime(Process::CLOCK_MONOTONIC). (require "benchmark" fails on this machine:
benchmark used to be loaded from the standard library, but is not part of the default gems since
Ruby 4.0.0
. That is a real removal, not a broken install.)
files in app/content/yield: 56
body bytes (rails-time-zones): 25622
Repository.all              : 11.45 ms
Repository.find(slug)       : 11.45 ms
Repository.neighbours(slug) : 11.48 ms
MarkdownRenderer.render     : 2.49 ms
ArticleStat.record_view     : 0.64 ms
ArticleStat.count_for       : 0.16 ms
SELECT 1                    : 0.01 ms
File.read all 56            : 1.3 ms
YAML+read one file          : 0.27 ms
Yield::Repository.all globs app/content/yield/*.md, reads all 56 files and builds an Article
for each, which means YAML.safe_load on 56 front matter blocks. (56 was the count the morning of
the run, before this page was added to the directory; the corpus grows and this cost grows with it.)
Reading all 56 files off disk is 1.3 ms of the 11.45; the remaining 10 ms is YAML.
YieldController#show calls
Yield::Repository.find, which calls all, and then Yield::Repository.neighbours, which calls
all again. The request parses the entire corpus twice before it renders anything: 22.9 ms of a
34.5 ms request, or two thirds of the page.
PostgreSQL is 0.8 ms of it. The UPSERT that increments the view counter costs 0.64 ms, reading the
count back costs 0.16 ms, and a bare SELECT 1 on the same connection measures 0.01 ms. Anyone
arriving at this page from a "Rails is slow because of the database" argument has the wrong suspect:
on the slowest public page of this site, the database is about 4 percent of the response.
The fix was measured rather than assumed. Driving the app in process with
ActionDispatch::Integration::Session, 30 warm-up requests then 200 timed ones, the shipped code
takes 34.5 ms per request. Aliasing Yield::Repository.all to a memoised version in the same process
and repeating the run gives 10.77 ms, a difference of 23.73 ms, which matches the profile almost
exactly. In throughput that is 29.0 to 92.9 requests per second on a single thread.
Those two numbers are in-process. ActionDispatch::Integration::Session runs the request without a
socket, so it measures the application and none of the HTTP path around it. The same page over a
real connection, through Puma at one worker and one thread, measures 42.229 ms. The 7.7 ms between
them is Puma, the socket and the middleware that only runs on a real request, and
the tuning post works from the 42.229 figure for that
reason. Neither number is the right one on its own: the in-process figure is what your code costs,
the HTTP figure is what a visitor waits.
show, repository re-read per request : 34.5 ms  (29.0 req/s single-threaded)
show, Repository.all memoised        : 10.77 ms (92.9 req/s single-threaded)
difference                           : 23.73 ms
That 3.2x is not free, and the cost is the reason the code does not already do it. Memoising the
repository means an edited Markdown file does not appear until the process restarts, which turns
"push the fix" into "push the fix and wait for a deploy" for a typo in a published article. The memo
is per process too, so four workers hold four parsed copies of the corpus in four heaps. The comment
in Repository.neighbours says it plainly: "Reading the list again rather than threading an index
through the controller keeps the ordering defined in exactly one place." That was a correct call at
four articles. At 56 it costs two thirds of the request, and at 200 it will cost more than the rest
of the stack put together.
ApacheBench reported 607 failed requests and none of them failed
Half the runs above first came back with a large Failed requests count, which reads like the server
falling over under load. The article run at 3 connections reported 607 of 1,000 failed, and a
homepage run reported 101 of 200. Neither did. The breakdown line, which the summary above it does
not repeat, names the reason:
Complete requests:      200
Failed requests:        101
   (Connect: 0, Receive: 0, Length: 101, Exceptions: 0)
ApacheBench records the length of the first response and counts every later response of a different
length as a failure. Both pages print a view count through number_with_delimiter, so the moment the
counter crossed 1,000 it gained a digit and a comma and the body went from 70,283 to 70,285 bytes.
Every one of those 607 responses was a 200: ab prints a Non-2xx responses line when there are
any, and no run here printed one. Pass -l on any page whose body is not byte-identical every time,
or read the breakdown before believing the headline.
Four Puma workers turned 27.75 into 70.61
config/puma.rb in this repository is 42 lines and never calls workers. It mentions
WEB_CONCURRENCY only in a comment, so the obvious reading is that setting the variable does
nothing and the Heroku Procfile line web: bin/rails server is stuck in single mode. That reading
is wrong, and checking it was worth the two minutes: Puma's own configuration defaults workers from
WEB_CONCURRENCY, and the server booted with it logs Puma starting in cluster mode... and
* Workers: 4 without a line of config.
WEB_CONCURRENCY=4, 3 threads each, 12 concurrent connections:
  /yield/rails-time-zones  ->  70.61 [#/sec]  mean 169.945 ms  p50 151  p95 305  p99 449
  /up                      ->  5,810.47 [#/sec]
Four times the processes bought 2.5x on the article page and 3.5x on /up. Processes are how Ruby
uses more than one core, and the price is resident memory: the four workers measured 342,480,
350,608, 348,352 and 368,192 KB of RSS against a master of 250,016 KB. Those figures overlap, because
macOS charges each forked process for the copy-on-write pages it shares with the master, so the true
total is well under the sum of them. The single-process server from the earlier runs is the cleaner
number, and it is not a reassuring one: 250 MB after boot, 603 MB after about twelve thousand
requests, with nothing in the configuration to reap a worker that grows.
Do not size a dyno from those figures, because Linux accounts memory differently and the production image is not this laptop. Size it from the ratio, which does travel: roughly a third of a gigabyte per Rails worker against 43.6 MB for the bare Rack process, and a memory bill that is linear in the worker count you need to use your cores. That is the real difference between Rails and a thinner stack, and it arrives as a hosting invoice rather than as a latency graph.
The counter said 3,828 views and the analytics table said nothing
Benchmarking a page that writes rows changes the rows, and the two write paths in this request
disagreed about what had just hit them. BotFiltered::BOT_UA is
/bot|crawl|spider|slurp|facebookexternalhit|embedly|quora|whatsapp|telegram|slack|twitterbot|linkedinbot|pinterest|vkshare|preview/i,
and ApacheBench/2.3 matches none of it, so every benchmark request ran
Yield::ArticleStat.record_view and drove rails-time-zones from 6 views to 3,828. ahoy_matey 5.5.0,
in the same action, logged [ahoy] Request excluded for every one of them, and ahoy_events stayed
at 113 rows across roughly twelve thousand requests.
Both filters are doing what they were written to do, and the site has two different definitions of a robot sitting in one controller action. The benchmark is what surfaced it, which is a reason to run load against a real endpoint rather than a synthetic one: a synthetic endpoint has no side effects to disagree about. The rows were reset afterwards.
The TechEmpower numbers, and why they are not printed here as fact
TechEmpower Round 23 is the source everybody cites for a cross-framework comparison, and the figures
in circulation put Rails around 42,500 requests per second on the Fortunes test, Node with Express
around 78,000, Django around 32,600 and Laravel around 16,800. Those numbers are not verified on this
page. https://www.techempower.com/benchmarks/ is a JavaScript application: fetched as a document it
returns its title, TechEmpower Framework Benchmarks, and no data at all.
https://tfb-status.techempower.com/, which the project's own README names as where live results are
published, refused the connection from here (ECONNREFUSED 173.196.11.130:443). So treat that
paragraph as widely repeated and unconfirmed, and go and read the numbers yourself in a browser
before you put them in a decision document.
Take them at face value anyway and the interesting thing is not the ranking. It is that the same framework which allegedly does 42,500 requests per second does 27.75 on the page you just read. The factor between those is about 1,500, and none of it is the framework. A Fortunes handler runs one query and renders a small table; a real page of a real product parses a content corpus, renders Markdown through a syntax highlighter, writes an analytics row and ships 70 KB. A comparison table tells you the cost of the floor. Your application is the building.
The call, and what would change it
Choose on something other than framework throughput, because at the traffic almost every product actually has, the framework is not what is slow. 27 requests per second per process is 2.3 million requests a day from one process, on a page that was never optimised, on a laptop. If your Rails app is slow, the profile above is the shape of the answer you will find: one call in your own code, usually doing IO or parsing in a loop, costing more than the entire framework around it. Rewriting that one call in Ruby is hours. Rewriting the application in Go is quarters, and it does not make PostgreSQL answer faster or Stripe respond sooner, which on most real endpoints is where the milliseconds are.
Two numbers deserve to be in the decision instead of a throughput table. The first is the time your slowest endpoint spends in your own code, which a profiler gives you in an afternoon and which decided everything on this page. The second is resident memory per process, measured on the image you actually deploy, because forking is how Ruby reaches a second core and every core therefore has a price in megabytes. Neither number appears in any framework comparison, and both of them are yours to measure before you commit a team to a language.
What would change this position: an endpoint that is genuinely CPU bound with no IO in it, served at a rate a box of processes cannot hold. Video transcoding, a pricing engine running a thousand simulations per request, a parser in the hot path. That work is where a compiled language wins by a factor nothing in Ruby recovers, and it is also the work you can move out to one service without touching the other ninety-five percent of the application. The 37signals case is a third thing again: a company that owns its hardware converts a CPU saving into a smaller purchase order, which a rented dyno does not.
What this post does not cover
No Node, Django, Laravel, Go or Spring Boot was run for this page. None of them is installed on this machine, and four framework comparisons resting on a benchmark that was never executed would be worth less than the one measurement here that was. So the two questions that bring most people to a page like this one, Ruby on Rails vs Node JS performance and Rails vs Django performance, are the two it deliberately does not answer: the vs-X figures quoted above are other people's, they are labelled as such, and no page here will carry a head-to-head number that was not run on a machine somebody here can see.
Also absent: YJIT and ZJIT, because the Ruby 4.0.5 built by RVM on this laptop has neither, so the
jitted numbers for the same code are unknown rather than unchanged; Falcon and the async stack, which
change the GVL story for IO bound work and not for this page; JRuby and TruffleRuby; HTTP caching,
Cache-Control and a CDN in front, which for a page like this one is the change that matters most
and makes every number above irrelevant; fragment caching and Solid Cache, which would remove the
Markdown render rather than the YAML parse; PostgreSQL tuning, since the database never got near
being the constraint; and anything about latency over a real network, because every request here went
over loopback.
Comments
No comments yet. Be the first.