Rails performance improvements, ranked by what they actually moved
The list of Rails performance advice is the same on every page that publishes one, and almost none of
it is ranked. Fix your N+1 queries, add indexes, cache fragments, tune Puma, use pluck. What
nobody says is which of those was worth anything on a specific application, because saying that
requires running them. So I profiled one page of this site, ran each of the usual fixes against it or
against a database built for the purpose, and kept the numbers including the three that came back
negative.
Conditions, because a number without them is not checkable. Apple M2 Max, 12 cores, macOS
arm64-darwin25, Ruby 4.0.5, Rails 8.1.3.1, Puma 8.0.2, PostgreSQL 17.7 (Homebrew) on port 15432,
ApacheBench 2.3 from /usr/sbin/ab. The application runs RAILS_ENV=production locally against a
scratch database, so code is eager loaded and not reloaded per request. Where a database benchmark
appears it is a separate scratch schema of 200,000 posts (521 MB) and 1,000,000 comments (81 MB),
not the site's own tables.
The budget of one real request, printed
/yield/rails-time-zones is a Markdown article rendered to a 70,397 byte page. One worker, one
thread, ab -n 200 -c 1 with a browser user agent:
Requests per second:    23.68 [#/sec] (mean)
Time per request:       42.229 [ms] (mean)
  50%     42
  95%     47
The homepage of the same application, same run conditions, answers in 6.632 ms at 150.77 requests
per second. So the article page costs six times the homepage, and the question is what it spends it
on. The controller does two things that look like database work: Yield::ArticleStat.record_view
and an Ahoy event, both writes, both on a read path. It also calls Yield::Repository.find and
Yield::Repository.neighbours.
Timing the pieces from bin/rails runner, 30 runs each after a warm-up:
files=56 bytes=1156494
File.read x56                                      1.34 ms
Article.new x56 (read + YAML parse)               10.87 ms
Repository.all                                    11.10 ms
Repository.find + neighbours (what show does)     22.68 ms
MarkdownRenderer.render on that one article        2.28 ms
Every request figure on this page is measured over a real socket, through Puma at one worker and one
thread. Drive the same action in process with ActionDispatch::Integration::Session and it measures
34.5 ms instead of 42.229: no socket, no Puma, and the middleware that only runs on a real request
never runs. The comparison post works from that in-process
number, which is why the two pages quote different totals for the same page. The 22.68 ms below is
the same in both, because it is the application's own work and nothing about the transport touches
it.
Twenty two point six eight milliseconds of a 42 ms request goes to answering "which article is this,
and what are the two either side of it". Rendering the 25,622 bytes of Markdown that the reader
actually asked for, into 35,424 bytes of HTML, is 2.28 ms. Reading the bytes off the disk is 1.34 ms.
The remaining 10.87 ms per call is YAML.safe_load on 56 front matter blocks, run twice, because
find calls all and neighbours calls all again.
The change that was worth 3.7x
Memoising Yield::Repository.all for the life of the process is the whole fix. I measured it without
editing the file, by loading a TracePoint through RUBYOPT that prepends a module to the class
once its definition closes, so the running application was byte for byte the shipped one plus one
@__memo ||= super.
before   Requests per second:  23.68 [#/sec]   Time per request: 42.229 ms   p50 42   p95 47
after    Requests per second:  88.52 [#/sec]   Time per request: 11.297 ms   p50 11   p95 13
The saving is larger than the 22.68 ms the component benchmark predicted, and the gap is allocations.
GC.stat(:total_allocated_objects) across 20 runs:
Repository.find + neighbours                       16551 objects/run       1 GC runs
memoised lookup                                        2 objects/run       0 GC runs
MarkdownRenderer.render one article                 3440 objects/run       0 GC runs
Sixteen and a half thousand objects and 1.1 MB of strings per request, thrown away immediately. The direct cost is the 22.68 ms; the rest is the garbage collector paying for it later, on somebody else's request.
The cost of this fix, and it is not small: a memoised process never sees a new article. Deploying
becomes the only way to publish, which for a file-backed collection that ships in the slug is
already true, and would be unacceptable for anything an admin edits. The honest version for content
that changes at runtime is Rails.cache keyed on the directory's maximum mtime, which reintroduces a
cache read on every request. Measured below, that read is 0.356 ms against Solid Cache, which is
still 60 times cheaper than the parse.
A missing index is 36.390 ms and the same query with one is 0.053 ms
Foreign key indexes are the advice everybody gives and nobody measures, so here is the measurement on
1,000,000 rows. comments has no index on post_id, and the page needs a count for one post:
EXPLAIN (ANALYZE, BUFFERS) SELECT COUNT(*) FROM comments WHERE post_id = 199987;

 Finalize Aggregate  (actual time=34.530..36.326 rows=1 loops=1)
   Buffers: shared hit=10310
   ->  Gather  (actual time=34.438..36.321 rows=3 loops=1)
         Workers Planned: 2
         Workers Launched: 2
         ->  Parallel Seq Scan on comments  (actual time=11.048..30.277 rows=2 loops=3)
               Filter: (post_id = 199987)
               Rows Removed by Filter: 333332
 Execution Time: 36.390 ms
PostgreSQL threw two parallel workers at it, read 10310 buffers, and discarded 333,332 rows per
worker to find 5. CREATE INDEX index_comments_on_post_id ON comments (post_id) took 1.448 s and
produced an 11 MB index. The same query afterwards:
 Aggregate  (actual time=0.031..0.031 rows=1 loops=1)
   Buffers: shared hit=6 read=3
   ->  Index Only Scan using index_comments_on_post_id on comments  (actual time=0.024..0.027 rows=5)
         Index Cond: (post_id = 199987)
         Heap Fetches: 2
 Execution Time: 0.053 ms
Ten thousand three hundred and ten buffers down to nine, and 36.390 ms down to 0.053 ms. That is a
factor of 686 for 11 MB of disk and one line of migration, which is why this is the first thing to
check and not the fifth. The cost is on writes and on VACUUM, and the honest number for it is in
the section on the index the planner ignored.
N+1, ranked by what each fix actually costs
A 25-row index page, Post.where(status: "published").order(id: :desc).limit(25), 50 runs each,
against the 200,000 post schema with the post_id index in place. Query counts are from an
sql.active_record subscriber with SCHEMA and cached queries excluded.
author name, no preload                            5.18 ms     26 queries/run
author name, includes(:author)                     1.04 ms      2 queries/run
author name, preload(:author)                      1.10 ms      2 queries/run
author name, joins + select                        0.80 ms      1 queries/run
comments.count per post, no preload                4.96 ms     26 queries/run
comments.count per post, includes(:comments)       6.94 ms     27 queries/run
comments.size per post, includes(:comments)        2.24 ms      2 queries/run
comments_count column                              0.51 ms      1 queries/run
Two readings. The belongs_to N+1 costs 4.14 ms on a 25-row page, which on a page that takes 42 ms
is a tenth of the budget and worth fixing, and on a page that takes 400 ms is a rounding error that
three people will spend an afternoon on. Scale decides, not the rule.
The second reading is the one worth the section. includes(:comments) followed by
post.comments.count is slower than doing nothing, and it adds a query rather than removing 25.
Here is why, printed for three posts:
SELECT "posts".* FROM "posts" WHERE "posts"."status" = $1 ORDER BY "posts"."id" DESC LIMIT $2
SELECT "comments".* FROM "comments" WHERE "comments"."post_id" IN ($1, $2, $3)
SELECT COUNT(*) FROM "comments" WHERE "comments"."post_id" = $1
SELECT COUNT(*) FROM "comments" WHERE "comments"."post_id" = $1
SELECT COUNT(*) FROM "comments" WHERE "comments"."post_id" = $1
The preload ran, loaded every comment into memory, and then count ignored all of it and went back
to the database. size uses the loaded collection and does not. That count never consults the
preloaded association is covered in
Rails N+1 queries, from includes to strict_loading, including why
strict_loading does not raise on it. What that page does not have is the price, so here it is:
before the post_id index existed, the same three lines measured 438.53 ms with no preload and
478.94 ms with includes. Adding the preload made the page 40 ms slower and looked, in the log, like
a fix.
The real answer on that row is the last line. A comments_count column is 0.51 ms and one query,
roughly ten times cheaper than the best association-based version, and the reasons it drifts out of
sync are in Counter caches by hand.
Puma threads did nothing and Puma workers did everything
Nine configurations, ab -n 400 -c 8 against the unmemoised article page, each preceded by a
200 request warm-up and a fresh boot. RAILS_MAX_THREADS sets both the Puma thread count and the
Active Record pool size in this application's database.yml, so the two move together.
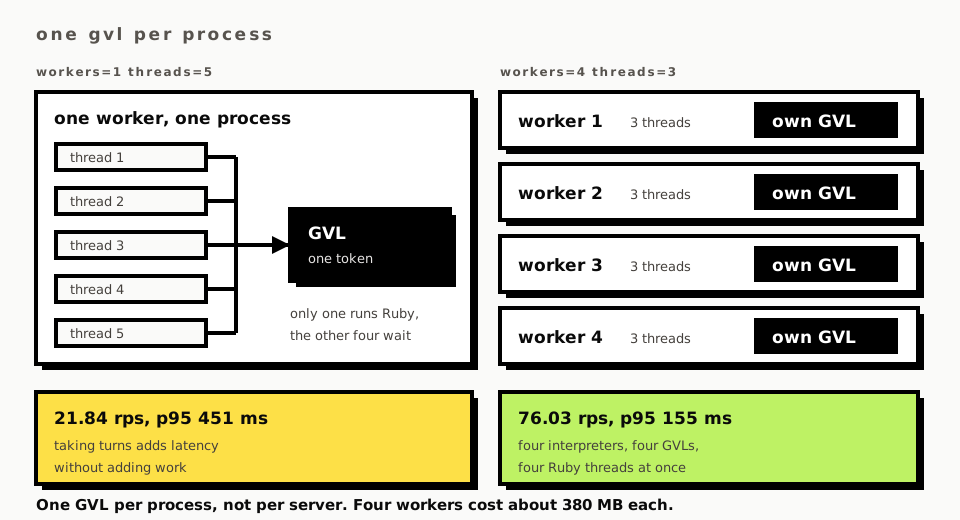
workers=1   threads=1    rps=22.32    p50=357   p95=376   p99=389
workers=1   threads=3    rps=22.12    p50=369   p95=400   p99=407
workers=1   threads=5    rps=21.84    p50=375   p95=451   p99=461
workers=1   threads=16   rps=22.19    p50=360   p95=370   p99=374
workers=2   threads=3    rps=40.70    p50=185   p95=280   p99=355
workers=4   threads=3    rps=76.03    p50=102   p95=155   p99=207
workers=4   threads=5    rps=79.00    p50=98    p95=155   p99=217
workers=8   threads=3    rps=122.19   p50=62    p95=81    p99=106
workers=12  threads=3    rps=131.88   p50=56    p95=72    p99=113
Sixteen times the threads bought 0.6 percent less throughput. Eight times the workers bought 5.5 times the throughput. The p95 at one worker gets worse as threads go up from 1 to 5, which is the textbook GVL result showing up in a real measurement: threads that cannot run Ruby simultaneously still take turns, and taking turns adds latency without adding work.
Nothing here contradicts the Puma documentation, which says threads help when the process is waiting
on IO. The point is that this page does no IO worth waiting on. It parses YAML and renders Markdown,
which is CPU, and RAILS_MAX_THREADS is the knob that is reached for anyway because it is the one in
the .env. If you want to know which side your slowest endpoint is on, the thread sweep above is
four boots and ten minutes and it tells you directly.
Workers are not free, and the currency is memory. Four workers at RAILS_MAX_THREADS=3, after 300
requests, vmmap -summary:
worker 67812: Physical footprint:  379.7M
worker 67814: Physical footprint:  373.0M
worker 67815: Physical footprint:  412.2M
worker 67816: Physical footprint:  380.0M
master 67806: Physical footprint:  182.4M
Around 380 MB of footprint per worker on macOS, where fork accounting is not Linux's and the copy-on-write savings are not what this number reports. Take it as an upper bound on one platform, not as a figure to size a dyno with. The shape of the trade is the part that transfers: workers cost memory linearly and buy throughput nearly linearly, threads cost almost nothing and, here, bought nothing.
Three things everybody recommends that did not help here
Threads are the first, and the table above is the evidence.
The second is getting the write off the read path. YieldController#show calls
Yield::ArticleStat.record_view and ahoy.track on every reader request, which is two database
writes on the most-read page of the site, and every performance checklist flags that pattern. The
controller already skips both for a crawler, so the A/B needs no code change at all, just a different
User-Agent header:
reader UA   Time per request: 42.229 ms   p50 42   p95 47
Googlebot   Time per request: 42.819 ms   p50 43   p95 47
Removing both writes made the page 0.6 ms slower, which is to say it did nothing and the difference is noise. Two indexed inserts into a local PostgreSQL are microseconds, and the checklist item is really about a write that contends for a lock or crosses a network, not about a write as such. I spent twenty minutes on this one before looking at the file globbing, and the ranking was upside down the entire time.
The third is fragment caching the article body. Against SolidCache::Store on the same PostgreSQL:
Rails.cache.write 35KB into solid_cache                 2.323 ms
Rails.cache.read 35KB from solid_cache                  0.398 ms
Rails.cache.fetch, cold every time (render 2.3ms)       5.205 ms
Rails.cache.fetch, warm                                 0.356 ms
Rendering the Markdown costs 2.28 ms. A warm fetch costs 0.356 ms and a cold one costs 5.205 ms, so
the break-even hit rate is h where 0.356h + 5.205(1 - h) = 2.28, which is 60.3 percent. On a
page with 56 articles, a cache that is evicted or invalidated often enough to drop under 60 percent
hits is a cache that loses money, and the prize at 100 percent is 1.9 ms out of 42. Cache keys and
what invalidates them are in Rails cache keys, and the store comparison is
in Solid Cache vs Redis. The relevant conclusion for this page is that
the thing worth caching was never the Markdown.
select and pluck: noise at 25 rows, 18x at 5000
posts here carries a 1,080 byte body column that an index page never displays. Selecting it
anyway is the cost of Post.all:
25 rows, select *                                       0.644 ms
25 rows, select(:id, :title)                            0.370 ms
25 rows, pluck(:title)                                  0.241 ms

500 rows, select *                                      7.018 ms
500 rows, select(:id, :title)                           1.653 ms
500 rows, pluck(:title)                                 0.754 ms

5000 rows, select *                                    62.477 ms
5000 rows, select(:id,:title)                          14.525 ms
5000 rows, pluck(:title)                                3.449 ms
At 25 rows the whole optimisation is worth 0.4 ms and is not worth the loss of a model object. At
5000 rows pluck is 18 times faster than instantiating, and if you are instantiating 5000 Active
Record objects to read one attribute off each you have a second problem anyway. The rule that
survives the measurement is about row count, not about pluck.
The index the planner never used
Adding an index to the column a WHERE clause names is not the same as adding a useful index. On
posts, 190,000 rows are published and 10,000 are draft. After
CREATE INDEX index_posts_on_status ON posts (status) and an ANALYZE, the page's own query:
EXPLAIN (ANALYZE, BUFFERS) SELECT id, title FROM posts WHERE status = 'published' ORDER BY id DESC LIMIT 25;

 Limit  (actual time=0.010..0.030 rows=25 loops=1)
   Buffers: shared hit=30
   ->  Index Scan Backward using posts_pkey on posts  (actual time=0.009..0.028 rows=25 loops=1)
         Filter: (status = 'published'::text)
         Rows Removed by Filter: 2
 Execution Time: 0.042 ms
The planner walked the primary key backwards, filtered two rows out, and stopped at 25. The new index
was never touched. After five runs of that query and every benchmark above it,
pg_stat_user_indexes reads:
       indexrelname        | idx_scan | idx_tup_read
---------------------------+----------+--------------
 index_posts_on_status     |        0 |            0
 index_comments_on_post_id |     2653 |        25505
 posts_pkey                |   201128 |       306982
That is 1400 kB of index, updated on every insert and every status change, and never read by the
query it was created for. It is not dead everywhere: SELECT count(*) FROM posts WHERE
status='draft' takes it for an index only scan at 1.622 ms, and status='published' also takes it
and spends 31.587 ms walking 190,000 entries to answer one number. That is the tell. An index on a
column where 95 percent of rows share a value is only ever chosen for the rare value or for a
full-column aggregate, and the ORDER BY id DESC LIMIT 25 that the page actually runs has a cheaper
path through the primary key. idx_scan is the column that tells you which of your indexes are in
this state, and almost nobody reads it.
How to reproduce these numbers, and where ApacheBench lies to you
Every run above starts with a warm-up, because the first request through a Rails process is not the
one you care about: the first hit on /yield/rails-time-zones after boot was 133 ms against a 42 ms
steady state.
ApacheBench reported Failed requests: 292 on a run where every response was a 200. The reason is
that ab compares each body's length to the first response's, and this page prints its own view
counter, which incremented from three digits to four during the run. Passing -l accepts variable
length bodies and the same run reports Failed requests: 0. A benchmark that says 97 percent failed
against a healthy server will send you looking in the wrong place for an hour.
One more, on Ruby 4.0: require "benchmark" now fails with cannot load such file -- benchmark
(LoadError) and the warning "benchmark used to be loaded from the standard library, but is not part
of the default gems since Ruby 4.0.0". Every timing here uses
Process.clock_gettime(Process::CLOCK_MONOTONIC) instead, which is what Benchmark was calling
anyway.
The order I would work in, and what would change it
Profile the request before touching the database. The page here spent 54 percent of its time in a
method that never opened a connection, and every instinct, mine included, went to the writes and the
queries first. rack-mini-profiler or an ActiveSupport::Notifications subscriber on
process_action.action_controller with the SQL time broken out will tell you in one request whether
you are looking at a database problem at all.
Then, in this order: foreign key indexes, because 36.390 ms to 0.053 ms is the largest single factor
on this page and the cheapest to apply. Then whatever the profile named, which will usually not be on
a list. Then WEB_CONCURRENCY, if the endpoint is CPU-bound, sized by memory. Threads last, and only
after measuring, because on this workload they were worth nothing and on an endpoint that spends its
time waiting on a payment API they would be worth everything.
What would change the ranking: an application whose slowest endpoint waits on HTTP rather than on CPU inverts the Puma half of it completely, and a page assembled from 30 partials rather than one Markdown blob makes the fragment cache pay where it did not here. The claim I am making is not that threads never help. It is that the thread count is the knob people turn first and the one that earned the least here, and that nobody finds out which case they are in without running the sweep.
What this post does not cover
No JIT numbers appear above. The Ruby 4.0.5 on this machine is built without both, and reports
ruby: warning: Ruby was built without ZJIT support and the same for YJIT, so I have nothing
measured to say about either and will not repeat what other people measured.
No memory figure for workers beyond the macOS footprint, which is a bad proxy for a Linux container and is labelled as such. I tried to get a clean marginal cost by watching system-wide app memory across boots and the machine was too busy for the deltas to be meaningful, so that number is absent rather than approximated.
Also absent: connection pool sizing under real concurrency, PgBouncer, Active Record query cache
behaviour across requests, jemalloc, asset and HTTP layer work including compression and CDN
headers, and background jobs, where the interesting question is queue latency rather than request
latency and none of the measurements here apply. Database-side tuning beyond indexes, meaning
work_mem, shared_buffers and autovacuum, is a different post and a different set of tools.
Comments
No comments yet. Be the first.